With the celebration of the country’s independence just around the corner, we as a top performance marketing agency believe the brands are preparing for one of the biggest sales seasons. As people are ready to set off fireworks, have get-togethers, and wear patriotic clothing, brands attempt to maximize their supplies, promotions, and costs to benefit from this boost. Predictive Analytics – a tool that can accurately predict sales for the given period and is of importance for brands willing to make the most of their Independence Day sales.
Understanding Predictive Analytics
Predictive analytics involves using historical data, mathematical models statistical models and machine learning to create a model that will predict future events.
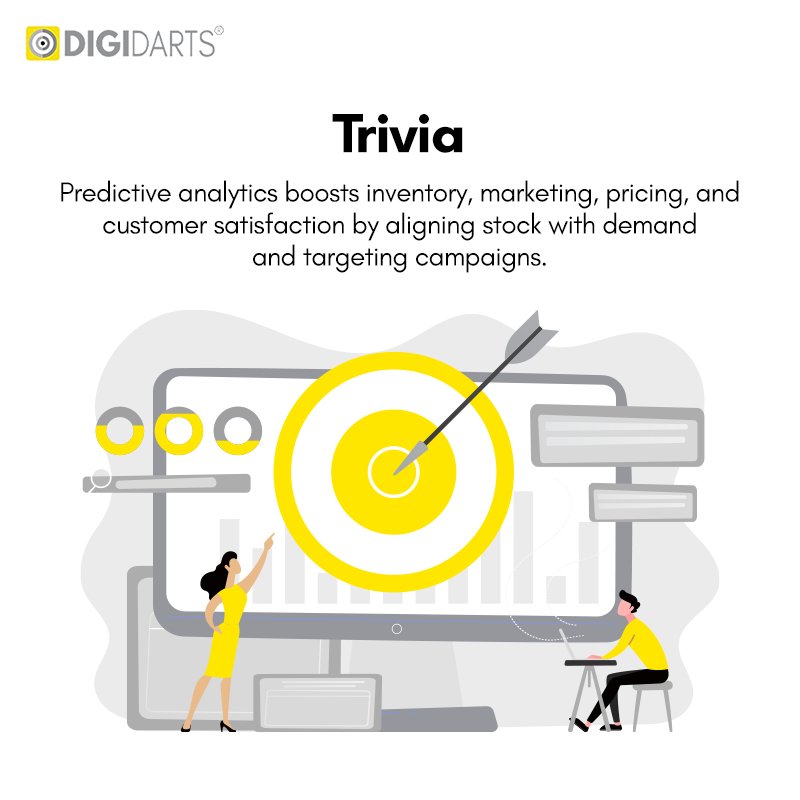
Through the assessment of historical sales data and understanding of the consumers’ behaviour and market trends, predictive analytics can then predict the demands, the most effective price policies, and the most suitable marketing strategies for the targeted consumer segments.
From this perspective, for brands, this implies better stock control, promotions, and consequently, sales.
The Independence Day Sales Landscape
Independence Day is associated with certain products and sectors – apparel in orange, white and green, outdoor accessories, fireworks etc. By using predictive analytics, brands can determine which products are likely to sell and in what quantities, thus ensuring that they order the right quantities of stock to meet customers’ demands.
Steps to Forecasting Independence Day Sales Trends
- Data Collection: The foundation of predictive analytics is data. Collect comprehensive historical sales data from previous Independence Day periods, including product categories, pricing, promotions, and customer demographics.
- Data Cleaning and Preparation: Ensure the data is clean and organized. Remove any inconsistencies or outliers that could skew the analysis. Segment the data by product category, region, and customer demographics to uncover specific trends.
- Model Selection: Choose the appropriate predictive model based on the nature of your data and the insights you seek. Common models include time series analysis, regression analysis, and machine learning algorithms like random forests or neural networks.
- Model Training and Testing: Train the selected model using historical data and validate its accuracy by testing it against a subset of the data. Fine-tune the model to improve its predictive capabilities.
- Forecasting: Use the trained model to forecast sales trends for the upcoming Independence Day period. Generate predictions for different product categories, regions, and customer segments.
- Actionable Insights: Translate the forecasts into actionable insights. For example, if the model predicts a spike in demand for fireworks in a particular region, adjust your inventory and marketing efforts accordingly. Similarly, if certain products are forecasted to sell less, consider offering promotions or discounts to boost sales.
Benefits of Predictive Analytics for Independence Day Sales
- Optimized Inventory Management: Avoid stockouts and overstocking by aligning inventory levels with predicted demand.
- Targeted Marketing Campaigns: Tailor marketing messages and promotions to specific customer segments, increasing the effectiveness of your campaigns.
- Dynamic Pricing Strategies: Adjust prices based on predicted demand to maximize profits and remain competitive.
- Enhanced Customer Experience: Meet customer expectations by ensuring popular items are readily available, leading to higher customer satisfaction and loyalty.
Real-World Example: A Retail Success Story
Let’s imagine an example of the national retail chain that decided to use predictive analytics for the forecast of sales on Independence Day. The retailer used data from previous sales records and realized that there was a gradual and steady rise in the demand for Independence Day-related merchandise. With this knowledge in mind, they rearranged their stock, advertised specific products, and created special deals on these products. The result? An overall sale that is twenty per cent higher than the year before, lower stocks, and the enhancement of customer satisfaction.
Conclusion
In the competitive retail landscape, leveraging predictive analytics to forecast Independence Day sales trends can be a game-changer. By harnessing the power of data, brands can make informed decisions, optimize their operations, and ultimately, drive higher sales and profitability. As we approach this patriotic holiday, let predictive analytics be your guiding star to a successful sales season.


